Did you know that 50% of Americans
are of less than average intelligence whereas 50% of the British are over
average intelligence?
If this
statement confirms your beliefs, makes you annoyed or in fact arouses any
emotion other than amusement, this article is meant for you.
Statistics is
the study of evaluating data. And today, more than at any time in history, we
are flooded with data. Data on the usefulness of seat-belts, different things
to do to reduce pollution, effect of smoking on lung-cancer, etc. etc. With
home computers and data-banks it is getting worse and worse. What should we do
with all these facts and percentages? Just memorize the more spectacular ones
and use them to win arguments? Or should we try to be a bit more critical? If
you think "yes", read on.
Take an
example. "A recent survey of smoking in Europe revealed that 84% of French
men smoke more than 10 cigarettes a day".
There you are.
A nice shiny fact. Compare it to the fact that 34% of Germans smoke (revealed
last week), and you can see that the French smoke about 2.5 times as much as
the Germans. Which just confirms what you knew already anyway. Remember when
you were in that bistro in Paris and those two men were smoking those filthy
Gaulois cigarettes? Whereas in Germany ... why in Munich they even had a
non-smoking area in McDonalds.
Well, remember
we are going to be a bit critical about these figures. Let's look at the `fact'
that 84% of the French smoke. Where did this fact come from? Did someone really
knock on doors all over France and ask sixty million French people "Excuse
me Monsieur" (or Madame or Mademoiselle) "Do you smoke more than 10
cigarettes per day?" A pretty mind-boggling task you would think, cost a
bomb, who paid for it and was it worth it. But let's assume it really was done.
Just think, 84% of the French smoke more than 10 cigarettes a day, that means
25.2 million packets a day, or put end to end 8316 times the height of the
Eiffel Tower (per day)!
But don't get
excited. Let's think more about the validity of this 84%. Suppose someone asked
you how many cigarettes per day you smoked (assume you do smoke, for the sake
of argument).
"Well,
sometimes I smoke 5, but if there's a lot of stress at the office it can go up
to 20." Actually you buy a carton of 200 per week and smoke most yourself
which works out as ... but you shy away from making this calculation.
Same with the
French. Some put down less because they have promised the wife to cut down, others
put down more because it's considered macho, yet others put down anything,
because they're French. That nice clean sharp 84% is already starting to look a
little frayed at the edges.
To confuse the
issue further, cigarettes are pretty expensive in France - the price is always
rising - so it would be nice to know some background. Has the French government
recently raised the tax on cigarettes? Or has there recently been a
`non-smoking' campaign?
It's beginning
to look as though that precise figure of 84% really just means that "a lot
of French smoke cigarettes" which you knew already.
But we'll
trace the figure to its source and call up the agency that supplied it.
Me "Is that
the DL Agency? I'm interested in that figure
you gave to Time Magazine the other day. quoting 84% of French smoking
more than 10 cigarettes per day."
DL
"84%?" Rustle of papers. "Yep, that's it. Came in last
week. I've got it on the computer here."
Me "Excuse
my curiosity, but 84% seems a very accurate figure. May I ask how you arrived
at it?"
DL "Well, I
don't do those projects myself. I think ..yes, we sent Joe to do it."
Me "Joe did
it. That must have been some big job. There are sixty million French and say
1000 a day. that works out at ..164 years, so .."
DL (aside)
"No, it's some nut. He thinks we counted every goddam Frog. (louder, to
me) "Ah, no sir. I'm sure Joe only checked a sample of Frenchmen."
Me (curiously)
"A sample? How big a sample? It would have to be a sample of typical Frenchmen."
DL "Sure,
sure. Why don't you let me put you through to Joe." Click, buzz.
Me "Is that
Joe? I understand you recently did a survey of European smoking habits and came up with a figure of 84% for the
French. Could you explain where you got that figure?"
Joe "Sure. My
boss sent me down to Kennedy airport and I got hold of the receipts of the Duty
Free shop and I checked how many people on the different flights to Europe
bought cigarettes."
Me "You mean
you checked all Air France passengers who went through Duty Free that day and
bought cigarettes, to find the proportion of French who smoke?"
Joe "Oh, no
sir. That would be very inaccurate. I only counted those who gave their
addresses in France. The DL Agency has a reputation for accuracy to
maintain".
Me "To come
back to the French. How many passengers did you actually count that day?"
Joe "Just a
minute, sir. I have the data right here." (clicking of computer keyboard)
"2350 passengers with French residence going to Paris, of whom 1974 bought
cigarettes which makes.. " (more clicking) "84.00%"
Me "I see.
But what about the `more than 10 cigarettes
smoked a day' which you had in your survey?"
Joe "Oh,
that. We got that from national statistics. It's well known that anyone who smokes at all usually smokes at least
10 per day."
Me "Thank
you Joe. You've been very informative."
Joe "My
pleasure."
Mein Gott. You
put down the telephone feeling the statistic of 84% is not worth the powder to
blow it to hell, and you would be right. Further errors you can see
immediately:
- Not everyone
who buys cigarettes in a Duty Free shop is a smoker: they are often being
bought for friends.
- You don't
have to be French to live in France. How many of the passengers were actually
French?
- And assuming
they were all French and all smokers, how typical of the general French
population were they? Only a very small proportion of the French fly to the US.
And we haven't
got to the “statistical errors” yet!
You might
think that the above case history is exaggerated, but it is very typical. It
uses new data, and is by present-day standards painstakingly accurate. Most
editors, wanting to quote the number of cigarette smokers in France, would look
up some data collected amongst Breton fishermen by the Marlboro Company in
1963.
Now, as
mentioned before, we live in a world flooded with data: "57% of the
population is blue-eyed", "Reducing speed on the motor-ways to
100kmph will reduce exhaust emissions by 14% and save 18% of the
woodland", "The Conservative Party is 11% ahead of all other
political parties", "Fluorine in drinking water saves 83% of teeth
from caries"...
These figures
pretend to define something which is `real'. There is a fixed proportion of the
population which has blue eyes, one of the political parties is ahead of the
others, there is an average age at which white male Caucasians die. But how to
find these figures? That is the problem.
Take eye colour, for example. It's just not possible to observe everyone
in the Kingdom and write down whether they have brown or blue eyes. It could be
done and it would give the `right' answer, but it would take a lot of effort.
The science of Statistics was developed to find an easier way.
Statistics
doesn't attempt to collect all the data, that would be too expensive and time
consuming, statistics "samples" the data. A statistician just looks
at (say) a thousand of the population and finds out how many have blue eyes.
From this he makes an intelligent guess as to the proportion of blue eyes in
the whole population.
Fairly easy to
do, you would think. After all, you just have to look at them. They can't hide
the fact that they have brown or blue eyes. They can't lie about it, like they
can about cigarette consumption. But think a bit more. Where do we get this
sample of 1000? It's no good looking in Scotland, where they almost all have
blue eyes. Nor would it be much use looking in inner-city Birmingham, which has
a large number of black immigrants. Ring up 1000 people and ask them their eye
colour? Brown-eyed immigrants don't have telephones.
So the big
problem in Statistics is to find a Representative Sample. And it doesn't get
any easier if you have to take a smaller sample - the smaller the sample the
more likely you are to make a mistake and take a `biased' sample.
But let's say
you have finally done it. Your sample has been taken from all over the country
- 1000 people from all walks of life, living in all geographical locations,
mixed up English, Welsh, Scots, Irish, immigrants. You have personally checked
their eye colours and you have a figure. How good is it?
Now you have
taken a sample of 1000 out of sixty million Britons. Do you have a sneaking
feeling that it was all a bit too easy? Well, your suspicion is well founded.
You can't fool around with Nature: you only sampled 1000 so you have to `pay'
for it somewhere. And the payment is that your answer is not very precise. You
cannot have too much confidence in it. It is the business of the science of
Statistics to show you how good your answer is.
Confidence level
Now before we
move on to the Statistics part of this essay, let's consider what is meant by
Error, because Statistics has a rather unusual way of talking about errors.
If you add 200
and 300 and come up with 498 you have an error. Not a bad one, only a 0.1%
error, but it would fail you in a maths exam. In maths no errors are allowed.
But in real life you're damn lucky if
you can do anything to 0.1% accuracy. Estimate your gas consumption from
Birmingham to Liverpool to 0.1%? Keep your speed constant to 0.1%? Work out
your weekly grocery bill to 0.1%? Very difficult.
But the answer
to a problem in Statistics comes out in a much more realistic or user-friendly
form. Answers in Statistics look like: 42 (CL +4), 568 (CL+9,-7), 24%(CL
0+2%). CL means Confidence Level.
Translation - 42 (CL+4)
means "I'm pretty sure the real answer lies between 38 and 46. It could be
outside these limits (ie. 36 or 50), but it's unlikely. As in: my wife tells me
she will meet me at a shopping centre at 2 o'clock. By experience I know this
means 2 o'clock (+5mins,+20 mins). I'm confident she will be there between 2:05
and 2:20. I would be surprised if she appeared outside these limits. These
limits are called Confidence Limits and are similar to the tolerances you have
when you buy steel girders or electronic components.
What
Statistics does is to enable you to estimate what these limits are under
certain conditions and tell you what you must do if you want them to be
tighter. You might guess that in the `blue eye' problem above, the way you
`pay' for taking a small sample of the population instead of the whole population
is in having wide confidence limits ie. not being very sure of the answer.
The +2ÖN rule
Here is an
interesting example attributed to Lord Kelvin (the one who said your knowledge
of anything is vague and unsatisfactory unless you can measure it). Suppose you
mark all the molecules in a glass of water and then pour the glass into the
ocean and allow them to mix throughout the seven seas. If you then took the
same glass and dipped it into any one of the seven seas you would find about
100 of the marked molecules in your glass.
There will be
a short pause while you gasp over this. Yes, there are a lot of water molecules
in a glass of water and that was what
Lord Kelvin was trying to illustrate.
But right now
we are interested in the fact that there are `about' 100 of the original marked
molecules in the glass of water you have fished out of one of the seas. What
this means is that if you kept on dipping your glass into the oceans and each
time counting the number of marked molecules in it, you would find the numbers
to be something like: 104,97,92,101,109,100, 110, 92 etc. In fact, let's
imagine someone actually does just that, about three or four thousand times and
makes a list. Then he goes through his list and counts up how many were the
same. Part of his list might look like:
No. of
marked molecules No. of
times
found
in the glass
113
298
114
300
115
304
etc.
He would then
plot these on a piece of graph paper and the result would look very much like
that below. You can see where he plotted the fact that when he looked in the
glass he found that 300 times there were exactly 114 marked molecules.
75 80 90 100 110
114 128 130
No. of molecules
in a glass
This is a very important graph. It is called a Gaussian Curve after
Herr Gauss, the man who discovered it. What can we say about this curve?
- Its maximum
value shows 1000 glasses contained 100 marked molecules.
- There were
no glasses that had less than 75 or more than 130 marked molecules in them.
- In fact,
because of the way the Gaussian curve flattens out at the extremities, you can
say that "almost all" (actually 95%) of the glasses had between 80
and 120 marked molecules.
This means (and don't skip this bit!) that if he
dips his glass once more into the ocean and counts the number of marked
molecules:
- He will
almost certainly find between 80 and 120
- The most
likely number is 100.
Now the
numbers I have used here are exact, this is what would actually happen. If the
glass he used was 10 times bigger, he would (as expected) fish out 10 times
more marked molecules ie. average value 1000 per glass instead of 100, but this
time he would find that the variation from glass to glass was less. The
variation (or dispersion) between most and least would only be 1000+63
(instead of 100+20).
In order to
calculate these figures, I am using a well know formula:
Dispersion = + 2ÖN
where
N = average number of marked molecules
Practical application
The +2ÖN rule
enables us to say something about the accuracy of a measurement. It gives you the
Confidence Level. In the Smoking Frenchmen case above, if we ignore all the
sampling errors, everything was decided on finding 1974 people bought
cigarettes. The dispersion of this figure is +2ÖN or 1974+88 so although the percentage
quoted was 84%, it could in fact be anywhere between:
1886/2350 = 80%
and 2062/2350 = 88%
So the next
time you hear a statistic ask yourself:
- What is the
sample size? Apply the +2ÖN rule and you will get the Confidence Level and be able to
see how valid the conclusions are.
- Was a
representative sample taken? Be critical. What sort of errors could creep in
and how were they avoided? Try to imagine how the data was actually taken and
you will usually see plenty of possibilities of mistakes being made.
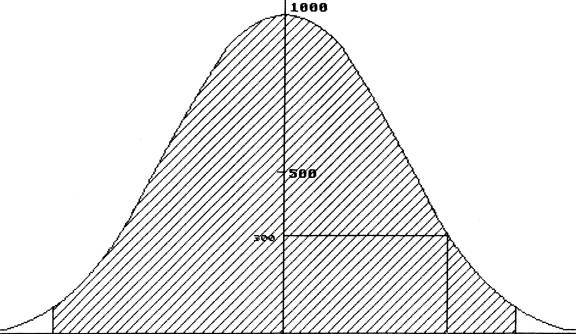
Above average intelligence
Now the reason
for the outrageous claim at the beginning of the "Statistics" may be
clearer. If you measure the intelligence of all Americans (however you do that,
whatever intelligence means… ) you will find that they will all be different, a
few genius level, a few morons, but most will be of the same or of
"average" intelligence. In fact they will be distributed as in the
Hr. Gauss’s curve. This Gaussian curve
is symmetrical which means that 50% of Americans are above average intelligence
and 50% below. There are also 50% of British above average intelligence and 50%
below. You start the argument by quoting half of one statement and half of the other!